Day 1: Introduction In this assignment you will see results from new product launches. Different companies have various ways to launch a new product. In some industries company marketing strategies can be Pull or Push . "Pull marketing strategies are tactics that firms use to increase the demand for products. These tactics aim to get customers interested in a product through advertising, word-of-mouth or promotions. Pull marketing strategies may involve advertising campaigns or promotional tactics that entice customers, such as offering discounts. Using engaging tactics may create loyal customers who may not only buy products but also refer them to others. Marketing teams use pull strategies to lead customers toward products when there is high demand in order to further increase that demand."1
"Push marketing is, as the name suggests, when you push your content right to the consumer. It’s also known as direct response marketing, or outbound marketing. Push marketing can apply to email offers, printed mailers, broadcast spots, point-of-sale displays, etc. -- anything that pushes specific advertising outward."2
Before I graduated from San Diego State University with a Bachelor's of Science Degree in Business Administration, many of the big corporations came on campus to interview students. I had many interviews and finally decided to go with a grocery products company called Purex Ltd. I was very impressed by the interviewers. One man was the district manager of the Los Angeles area and the other was the regional manager, responsible for the western half of the United States. Purex operated under the Push marketing strategy. They believed that its well-trained, well educated sales force could successfully sell their many products to all grocery stores in the US without a lot of national television advertising behind the product. We were taught to put together well designed presentations with fact sheets detailing how profitable our products were. We had monthly deals that we offered to the stores, using cents off labels, and case discounts. Our job was to sell additional product on these items in hopes that the grocery stores would build end dispays, give us additional shelf facings and good shelf position next to the best selling competitive products. The salepersons made visits to every grocery store in their territory. Larger volume stores were visited in every week. Wholesalers and headquarter accounts were seen at least once a month. I made ,on average, nine calls per day. We had incentives for the store managers, such as sets of steak knives. In many cases, we, the salespersons, would build the displays.
Purex major competitors in the 1960's were Proctor and Gamble, Colgate-Pamolive, Lever Brothers, and Armor Dial. They all emphasized the Pull marketing strategy, which made my job even more challenging. Many of them sponsored daytime television shows called soap operas.
A soap opera is a television or radio drama series dealing typically with daily events in the lives of the same group of characters.
Soap opera, broadcast dramatic serial program, so called in the United States because most of its major sponsors for many years were manufacturers of soap and detergents. The soap opera is characterized by a permanent cast of actors, a continuing story, emphasis on dialogue instead of action, a slower-than-life pace, and a consistently sentimental or melodramatic treatment.3
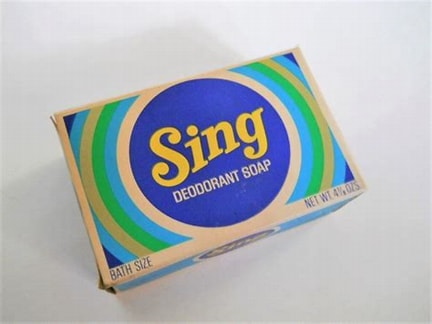
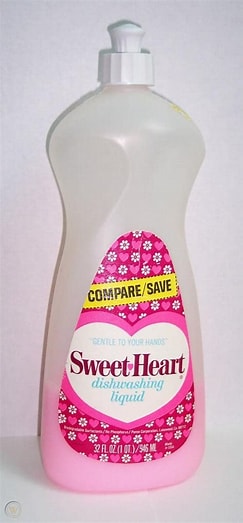
While I worked for Purex for approximately 2 1/2 years, the company came out with numerous new products that we were expected to sell to all of the customers in our territory. My teritory covered the San Fernando Valley. I sm sure that you probably have never heard of the these products: Bo-Peep amonia, Sweetheart fabric softner, Sweetheart liquid detergent, Brion a pre-soak enzyme, and Sing bar soap. These products are no longer on grocery store shelves. In those days, the 60's there were no personal computers, cell phones, tablets, no Internet, social media companies so the primary way of advertising new products was through television, radio, print media such as newspapers, magazines and billboards.
The data in this lesson is fictitious, but attempts to show the effects of pull and push marketing. The information gained from this type of marketing research is to help markeing executives allocate resources in keeping with the company's philsophy and get a winning product. The cateories covered are:
Planning for new products
Unique Product
Target Market
Technology Synergy
Marketing Synergy
Sales Force
Profitability
Competitive Pricing
Effective Promotion
Channels of Distribution
Planning
It goes without saying, that effective planning is critical when adding a product. Good planning incudes a team made up of reprentatives from project management, marketing, operations and engineering. Each member of the team contributes their expertise and then collaborates with others in the organization to create a product that our customers want. Do marketing research to study to furthur your knowledge about competitors' pricing and their marketing strategies
Unique Product
What makes your product so special and different from your competitors? How will a new product affect your existing line of products? What feaures does it have that can distinguish it from other competing products.
Target Market
Make sure that you know what customers you will appeal to. Are they the same target market or segment that you sell your existing products to.
Technology Synergy
Synergy happens when one plus one no longer equals two. Artifical intelligence will have a large impact on product development. The AI machine learning, image recognitiona and speech recognition work together to improve the purchasing experience for consumers. AI needs to be structured as to be ethical and not invade consumers' privacy.
Marketing Synergy
Synergy in marketing is when two marketing initiatives create a response greater than the sum of the combined responses. An example might include social media advertising and television advertising, web site all giving the consumer different impressions on your brand.
Sales Force
In the "Push" marketing approach to marketing, a well train and well educated sales force is critical to success for new products. The sales force is responsible for getting the new product to the stores that sell to the final consumer.
Profitability
For a product to be successful, it need to be profitable for the manufacturer, wholesaler and retailer. Push marketing emphasizes greater profits than products pulled through the distribution channel.
Competitive Pricing
Any product that is new must be priced similar to existing competitors' items. Coupons, loyality programs, special promotions should be offered for ne product development.
Effective Promotion
Promotion involves a number of factors: Advertising, social media posts, Internet advertising, product influencers, loyality programs, free samples, contests, sweepstakes, event marketing.
Channels of Distribution
Channels of distribution include direct sales, wholesalers, retailers, delivery service companies and Internet sales.
Day 2: The data collected.
The data collected is supposed to represent data on new product introductions. For a product to be deemed successful, numbers awarded 1-5 added and then avearged and must be at least 80% to be considered a positive result.
The data represents 50 responses to a survey of the major suppliers of soap products. The survey asked the repondents to answer with a 1,2,3,4,5.
A 5-star survey is a customer feedback questionnaire that uses a 5-point rating scale to assess satisfaction with a product or service. The concept is simple: customers are asked to rate a product, service, or experience on a scale of 1 to 5 stars.
The specific meanings of the 5-star rating scale labels may vary depending on the survey, but in general, ⭐⭐⭐⭐⭐ represent excellent or outstanding performance, while ⭐ points to a poor experience. This type of customer satisfaction survey is widely used across various industries as it is quick to complete, and the scale is easy to interpret.
Question 1: How would you rate the planning and development of new products?
How unique is your product among similar products?
How confident are you that you have targeted the correct market for this new product?
Rate your technology synergy for this new product.
Rate your marketing synergy for this product.
Rate the resources that you have invested in your sales force.
Rate the profitability of this product.
Rate the pricing of this product compared to the competition.
How have you effectively promoted this product?
Rate the channels of distribution for this new product.
Here is a parial list of the products.
Clorox Liquid Bleach,Purex Liquid Bleach,News Detergent, Charmin Brillo, Sweetheart, Purex Bleach, Tide Detergent, Gain Detergent, Bold Detergent, Duz Detergent, Dreft Detergent, Ajax Detergent, Cheer Detergent, Fab Detergent, Cold Power Detergent, Surf Detergent, Purex Detergent, Oxodol Detergent, All Detergent, Comet Cleanser, Dutch Cleanser, Ajax Cleanser, SOS Scrub Pads, ScotchBrite Scrub Pads, Ivory Liquid Detergent, Vel Liquid Det, Trend Liquid Dete, Palmolive Liquid Det, Dawn Liquid Detergent, Dial Liquid Detergent, Cascade Dishwasher Det, Finish Dishwasher Det, Vano Fabric Soft, Sweetheart Fab Soft, Downy Fabric Softner, All Fabric Softner, Beads O Bleach, Chlorox Dry Bleach, Axion Presoak, Brion Presoak, Safeguard Bar Soap, Zest Bar Soap, Irish Spring Bar Soap, Fels-Naptha Bar Soap, Sing Bar Soap, Lifebouy Bar Soap, Dove Bar Soap, Dial Bar Soap, Yardly Bar Soap, Aveno Bar Soap, Lava Bar Soap, Gay Bouquet Bar Soap, Camay Bar Soap, Secret Bar Soap, Ivory Bar Soap, Cashmere Bouquet Bar, Soft Soap, Shield Bar Soap, Swan Bar Soap.
Our data scientists have compiled the data into a Python Dictionary and plan to use Jupyter notebook to key in their Python application. For a prouct to be successful, it needed to come up with a 4.0 score out of 5.0 or better. Successful products were given a 1 and unsucessful products were given a 0. The results have been added to the Pandas DataFrame.
We are going to use artificial intelligence, machine learning algorithum Random Forest to predict how we should allocate resources to make our new product, Sweetheart Liquid Detergent, successful. The marketplace is crowded with liquid detergents and automatic dishwasher soap has negatively impacted the liquid detergent market. Our company's philisophy is classfied as PUSH. Our top marketing executives are hoping that this data can help them predict a winning combination of resourcs.
Importing the Python libraries
Click copy text button, Open a new Python Juputer Notebook and paste the contents into the first frame.
Save your application.
The Pandas DataFrame
Click copy text button, Add a new frame and paste the contents into that frame.
Save your application.
The organization of the DataFrame is as follows: the column names are listed first. The rows, each respondents' answers, are listed vertically. For example, respondent 1, answered the planning question with a 4, uniue product with a 4, target market with a 4, technology synergy with a 4, marketing synergy with a 4, sales force with a 5, profitability was a 5, competitive price was a 5, effective promotion was a 4 and channels of distribution was a 5. Our data scientists filld in the result number. They calculated it by getting the average of all ten numbers. Numbers greater or equal to 4 are given a 1. Numbers less than 4 were awarded a failing score of 0.
Defining variables for the DataFrame
Click copy text button, Add a new frame and paste the contents into that frame.
Save your application.
The df is defined. Next, the independent variables are assigned to X. y is the dependent variable. Note X is uppercase and y is lower case.
Your results should look like the image below.
Day 3: Printing DataFrame and Making Predictions
First we are gong to printout a slice of the Pandas DataFrame. We will start with 10 rows. The iloc property gets of sets the value(s) of the specified indexes. Key in he following line and run all cells. You should get results like the image below.
(df.iloc[0:10]
You can use the slide bar to see additional columns. Now Change the number of rows to 80 instead of 10 to see the top and bottom parts of the DataFrame.
Click copy text button, Add a new frame and paste the contents into that frame.
Save your application.
Run all cells.
Train test split evaluation is a technique for evaluating performance of a machine learning algorithum. It can be used for both supervised regression and clasification problems. Here are the steps involved.
Divide the dataset into two subsets: X_train and X_test and y_train and y_test
The training dataset is one of the subsets, y_train. It represents, in our case 80% of the data or 40 respondents.
The test dataset, y_test and it represents 20% of the responses or 20
The first subset is used to fit the model and it is called the training dataset:X_train and y_train.
The second subset is called is the input element of the dataset provided to the model: X_test and y_test.
X_test learns from X_train, independent variables unique product, tech synergy, market synergy, target market, sales force, etc.
y_test learns from y_train, the results product successful or not
Predictions are made compared to the expected values from X_test.
The random state code makes each run give the same results. If you remove that code you will get different results since different records are selected for the run.
Since this is a classification problem we are going to use RandomForestClassifier with 20 trees.
Next we train the model with the fit code line.
The objective is to estimate the performance of the machine learning model on new data :data not used to train the model.
Next we make predictions based an the X_test array.
Click copy text button, Add a new frame and paste the contents into that frame.
Save your application.
Run all cells.
y_train represents the random selection of 80 items from the result line of the dataset. If you run it you will get 80 records with the results 0 or 1. Remember 0 means the product was a failure and a 1 means that the product was successful. For example.
Record 77 was a succesful new product.
Record 32 was also a successful new product.
Reecord 19 was not a successful new product.
Click copy text button, Add a new frame and paste the contents into that frame.
Save your application.
Run all cells.
The y_test subset contains 20 records that were randomly selected. Some of the information from the run is listed below.
71 was a sucessful new product
32 was sucessful
19 was unsucessful
Click copy text button, Add a new frame and paste the contents into that frame.
Save your application.
Run all cells.
X_train contains 80% of all items. In our case that is 80,
Click copy text button, Add a new frame and paste the contents into that frame.
Save your application.
Run all cells.
Click copy text button, Add a new frame and paste the contents into that frame.
Save your application.
Run all cells.
Here are the actual and predicted values.
Look carefully at the actual and predicted amounts. They are all a match. which means that these were successful new product introductions.
Pull Stragegy
Remember that the marketing strategy labeled "Pull" entails doing a lot of national advertising with the goal that the consumer will demand that the store carry the product. The sales force is not nearly as an important element. Profitability and competive pricing play insignificant roles in the marketing mix.
We can represent these items in our Python code. Here is the code, the way I see it for this kind of strategy.
Click copy text button, Add a new frame and paste the contents into that frame.
Save your application.
Run all cells.
Here are the predicted value for the Pull strategy.
Was this a succesful strategy?
Our company's Push strategy
Our goal is to come up with a successful marketing plan for our new liquid detergent that fits in with our company's overall marketing strategy. We need to allocate our resources in an efficient way.
Try these numbers in the line of code which makes the prediction. Note: heavy emphasis on planning, sales force, competitive pricing, profitability and channels of distribution
Channels of distribution: sales force pitches jobbers, headquarter account as well as individual stores.
Planning = 5
Unique product = 3
Target Market = 4
Technology Synergy = 3
Marketing Synergy = 4
Sales Force = 5
Profitability = 5
Competitive Pricing = 5
Effective Promotion = 1
Chananels of Distribution = 5
Confustion Matrix
Click copy text button, Add a new frame and paste the contents into that frame.
Save your application.
Run all cells.
Here is the confusion matrix.
The rows correspond to the actual labels.
The columns correspond to the predicted labels.
True positives (TP): occur when the model accurately predicts a positive data point.
True negatives (TN): occur when the model accurately predicts a negative data point.
True positives (FP): occur when the model predicts a positive data point incorrectly.
False negatives (FN): occur when the model mispredicts a negative data point.
How many of each do you get when running the different predictions?
Classification Report
Click copy text button, Add a new frame and paste the contents into that frame.
Save your application.
Run all cells.
Here is the classification report and accuracy score.
Here is what my classification report looks like after my last run. The model did a very good job!
Day 4: Pandas DataFrame with product names
In this section we are going to exammine a new dataset with 61 items: All soap type items. Some of these items are no longer on grocery store shelves. I made up the data and it does not represent anything real.
Click copy text button, Start a new Python project, add a new frame and paste the contents into that frame.
Save your application.
Run this cell even if there is no output.
Looking at one record
Click copy text button, add a new frame and paste the contents into that frame.
Save your application.
Run this all cells.
This code creates an alphabetic index instead of a numeric one and prints out the record for Purex Liquid Bleach. Your screen should look like the image below.
Looking at two records
If you wanted to compare Dutch Cleanser and Ajax Cleanser, this code is helpful.
Click copy text button, add a new frame and paste the contents into that frame.
Save your application.
Run this all cells.
What scores does each cleanser have in common?
Bar Soaps
Make a new frame and key in in the following code. Run it and answer the following questions.
#To evaluate all bar soaps. Start with first bar soap in dataset and then list last bar soap
How many products failed? Are there any with a 1 score for effective promotion that still succeeded?
Products with results greater than zero
Key in the following code ina new frame. SAve it and run the progam and answer the following question. How many failed?
#To see all products that were successful
SalesForce = 5 and Results =1
#evaluate multiple conditions
Key code into a new frame and then name the products that meet that criteria?
Successful products that are profitable. Key in the code below in a new frame and report your results.
#specify column nqmes to fetch values along with a condition
 Importing the Python libraries