Now let us look at another problem. Let's suppose that we are a company that remodels kitchens. We do everything from a $20,000 job to ones cost over $100,000.
It takes anywhere form 3 to 16 weeks to complete the remodeling jobs.
We keep track to see if we are on schedule and on budget. We also keep track of the bid: if it was awarded to us or if we did not get the contract.
We keep track of our jobs on the following spreadsheet.
Download this spreadsheet and print this out as we will need to create a dataset in Python using this information.
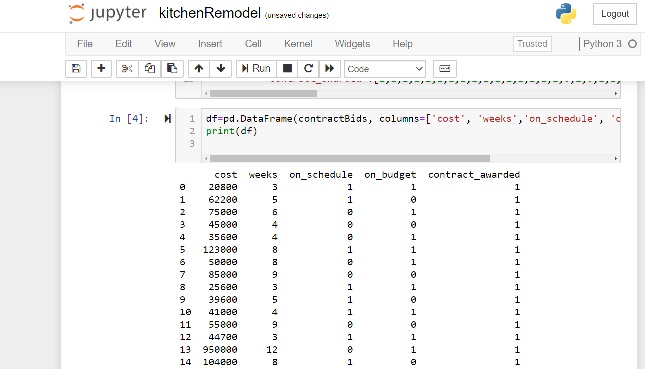
As you can see we keep track of: cost, weeks to complete the job, if we guarantee that we will be on schedule, and not go over the budget.
We have coded some of the fields to reflect true or false. A 0 means false and a 1 means true.
For example, looking at index 3, our $45,000 kitchen was estimated to take 4 weeks to complete. We did not guarantee completion within 4 weeks. We were, however, able to guarantee that we would be on budget
Our Python model using the Random Forset algorithum will attempt to analayze this data and determine the most important factor in awarding contracts and give us a tool for predicting the success of getting future contracts.
Code for this assignment came from an article entitled Data to Fish Example of Random Forest in Python.3
I modified it to use in our kitchen remodel assignment.
Load Python and Jupyter notebook for this problem. Open a new file.
Use the Copy Text button to put the above Python code on the clipboard.
Paste it into your Jupyter Notebook.
Save it.
Copy the information from the spreadsheet just below the code you just copied.
Use the Copy Text button to put the above Python code on the clipboard.
Paste it into your Jupyter Notebook.
Save it.
In Jupyter Notebook, Click on Insert then Insert cell below to get a new box for the next slice of code.
Use the Copy Text button to put the above Python code on the clipboard.
Paste it into your Jupyter Notebook.
Save it.
Day 3
Now run your code either cell by cell or Kernel and restart and run all
You should get the entire data frame printed out on your screen.
Use the Copy Text button to put the above Python code on the clipboard.
Paste it into your Jupyter Notebook in a new cell
Save it.
This code is where the Test X and train Y are created. They represent 25% of all cases. and they are chosen at random.
Run this cell just to check the synatx.
Use the Copy Text button to put the above Python code on the clipboard.
Paste it into your Jupyter Notebook in a new cell
Save it.
When you run all the cells, here is the output you will get. Let's examine these predictions and see what they mean.
Index
Cost
Weeks
onSchedule
onBudget
22
6500
6
1
1
20
10000
9
1
1
25
28500
4
1
1
4
35600
4
0
1
10
4100
4
1
1
15
78200
6
1
1
28
67250
6
1
1
11
5500
9
0
0
18
53500
4
1
1
29
87500
8
1
0
[1 1 1 1 1 1 1 1 1 0]
Ten items from the spreadsheet were chosen at random.
Ten is 25% of the 40 items on the contract bid spreadsheet.
These ten are shown including cost, weeks on schedule and on budget.
The confusion matrix is shown below the ten items.
It shows which bids were awarded in the actual data above in the printout of the entire data frame.
For example, items 22,20,25,4,10,15,28,11 in the actual data were awarded contracts.
Item 18 in the actual data did not receive a contract.
Item 18 in the test or prediction data did receive a contract. This is called a false positive.
Item 29 in the actual data did receive a contract, but the prediction was that they should not receive a contract. This is false negative.