Day 4: KNN Classifier
We are now going to look at our spreadsheet data from the survey and run it through another Python algorithum.
The kNN algorithm is a supervised machine learning model. That means it predicts a target variable using one or multiple independent variables.
We have four independent variables:Travel, Internet, Social Media, Friends, TV and radio.
We have one dependent variable: book a trip or not book a trip.
The booking variable is dependent upon one or more of the independent varibles.
K-nearest neighbor or K-NN algorithm basically creates an imaginary boundary to classify the data.
The algoritumn does not assume any relationship between the independent variables.
When new data points come in, the algorithm will try to predict that to the nearest of the boundary line.
Let's look at the code and compare the results to the SVM model.
Much of the code is very simliar.
Cell 1
Start a new Jupyter Notebook Python project.
Paste this code in your first cell.
Save your project.
Cell 2
Paste this code in your second cell.
Save your project.
There is no output from this cell. It reads in the dataset from and Excel spreadsheet and assigns it to a variable called df.
Cell 3
Paste this code in your third cell.
Save your project.
Run the code of the first three cells and you should see the size of the dataset, (220,7).
Cell 4
Paste this code in your forth cell.
Save your project.
Run the code of the first four cells and you should see the head and tail of the dataset.
Cell 5
Paste this code in your fifth cell.
Save your project.
Run the code of the this cell and you should see the dataset described.
Cell 6
Paste this code in your sixth cell.
Save your project.
The code in this cell assignes the value of all the independent variables to the variable X.
Cell 7
Paste this code in your seventh cell.
Save your project.
The code in this cell assigns the values of the dependent variables to the variable y.
Cell 8
Paste this code in your eighth cell.
Save your project.
The code in this cell assigns training and test variables to the train test split algorithum and sets a sample size for the random array of 20%
Cell 9
Paste this code in your nineth cell.
Save your project.
The code in this cell creates a vriable for the classifier
Cell 10
Paste this code in your tenth cell.
Save your project.
Cell 11
Paste this code in your eleventh cell.
Save your project.
Predictions are made from X_test and then printed out.
The output from this cell looks like the information contained in the file below.
KNN Predictions
The predictions are a 20% sample, randomly selected from the dataset.
There 44 in the test file.
The predictions are y and n and are listed at the bottom of the file.
Respondent 152, 74 based on the model predictions, would book a trip {Y}.
If you look at the actual data from the spreadsheet, it would confirm this prediction.
Respondent 71 would not book a trip based on the predictions.
Actual data also confirms this prediction.
For example our model predicted that 37 of the 44 predicted outcomes Y booked a trip (TotalPositives)
Our model predicted that 7 would not book a trip (Total Negatives).
Our model predicted that 2, #90 and #101 would not book a trip when the actual numbers indicated that they would book a trip (False Negatives) .
False negatives and false positives indicate an error in our model. But it does not seem very serious based on the number of occurrences (2).
Cell 12
Paste this code in your twelfth cell.
Save your project.
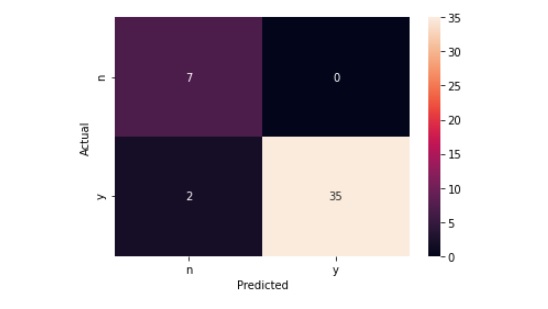
Confusion Matrix.
Cell 13
Paste this code in your thirteenth cell.
Save your project.
This cell gives you a graphical representation of the confusion matrix.
Analysis of Results
The df.describe() function provides some helpful information.
]
Looking at the mean values for each advertising media, you could make some decisions as to how best to advertise your site.
Internet advertising had a mean of 3.67 out of 5 possible choices.
Social Media had a mean of 2.45.
Radio has the lowest mean of 0.76
It seems that it would be better to use our advertising money on Internet and social media rather than tv, radio or travel magaines.
Looking at the confusion matrix, we can see that 35 out of the 44 were TP, those that would book a trip based on our predictions.
Thirty five represents almost 80% ,35/44.
Seven that came up True Negative in our projections and indicated they would not book a trip, 16%
Precision, Recall and F1 scores were all good.
Accuracy was at 95%
K value and error rate