Day 5: Importing Excel Data and working with Pandas
With Pandas you can work with files in various formats: text files, comma separated value (csv) files and MS Excel files. The elements in a Pandas series are assigned indexes. The first element is assigned an index of 0, the second one 1 the third one 2 and so on. The last element is assigned an index of N-1 with N denoting the total number of items.
Most of you have probably worked with Microsoft's Excel spreadsheet. We are able to import an Excel spreadsheet into a Pandas dataframe. Many business records are stored in Excel sheets: Customer information, Accounting and financial records, etc.
We are going to work with some customer information for a sporting goods store.
First you need to download the Excel spreadsheet and save it into your working folder.
This spreadsheet is quite small. Normally customer records would have thousands of records. I am using this small sample, just to give you an idea what it would be like to use Python's Pandas library to do data analysis.
Now open Spyder text editor and key in the following lines. Save the code using a file name with a .py extension. Run the file using F5 or F9
Answer the worksheet questions relating to this section.
import pandas as pd
Import sys
sys.__stdout__= sys.stdout
data = pd.read_excel('CustomerOrdersDept.xlsx')
print(data)
Add the following line to the end of your code. data.describe() Save and run.
This line describes the data base and gives very important information: Number of records, the mean or average sale, tax and total, the lowest and highest sales, tax and total.
Suppose you were looking for best sellers?
Add this line. data[data.ProductDescription == 'Nike Shorts']# search for individual items purchased
Save and run. What did you find out?
Suppose you wanted to see buying habits of a particular customer, add this line at the end of your code.
data[data.CustomerLastName == 'Hall']# find all purchases by Hall
When you run the code, you will find two orders by a customer named Hall. Check the record numbers and you can then look up the entire transaction on the spreadsheet.
To see all records by Last name, description and department, key in the following line.
print(data.loc[:,['CustomerLastName','ProductDescription','Department']])# printout all data customer last name, product description and department of the item
To see customer last names, items purchased and departments for records 0,3,6, add the following line.
print(data.loc[[0,3,5],['CustomerLastName','Department']])# select 0,3 5 array elements and display customer last name and department purchased item belongs to
Knowing department sales is an important part of data analysis. Python's Pandas library has a functioon to give us that information.
Add these lines of code, one for each department. Save and run.
data[data.Department == 'Apparel'] # show all apparel sales
data[data.Department == 'RollerSports'] # show all roller sports sales
data[data.Department == 'Baseball'] # show all baseball department sales
data[data.Department == 'SportingArms'] # show all gun sales
data[data.Department == 'Football'] # show all footballl sales
data[data.Department == 'Basketball'] # show all basketballl sales
data[data.Department == 'Soccer'] # show all soccer sales
data[data.Department == 'Outdoors'] # show alloutdoors sales
data[data.Department == 'Fitness'] # show all fitness sales
data[data.Department == 'WaterSports'] # show all water sports sales
data[data.Department == 'Golf'] # show all golf sales
data[data.Department == 'Knives'] # show all knives sales
data[data.Department == 'Tennis'] # show all tennis sales
The rows and columns information at the end of the list gives the total number of records or rows in that given department.
Answer the questions on the worksheet regarding department sales.
You can select very specific parts of each record using the following code examples.
print(data.Price[15])
print(data.Total[50])
Add these lines of code and try then out. Answer the worksheet questions pertaining to these two lines of code.
Add this line of code next.
print(data.Department)# prints all invoices and the departments associated with the sale.
To get customer last name, product description and price add this line of code.
print(data.loc[:,['CustomerLastName','ProductDescription','Price']])# printout all data customer last name, product description and amount spent on the item
You can also use the Pandas library to sort things. Let's say you want to see a sorted list form low to high of all prices of your products. Try this code.
PriceList=sorted(data.Price)
Suppose you are looking for regular and repeat customers, try sorting customners' last names with the following two lines of code.
If their name appears more than once they are repeat customers and you should reward tem for their repeat business.
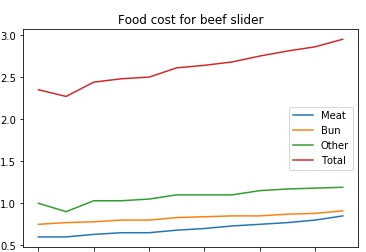
In starting your own business, examining price is an important thing that needs to be addressed in the business plan.
When determining what price to put on an item, you need to know the costs involved. In this particular case, the product is a beef slider sold from a food truck.
The costs involved are the cost of the meat, the bun, the other ingredeients.
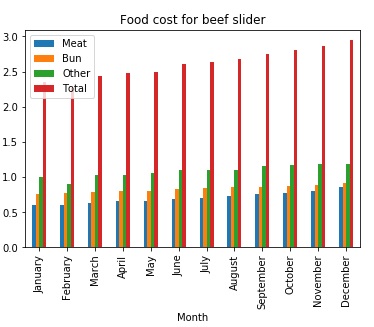
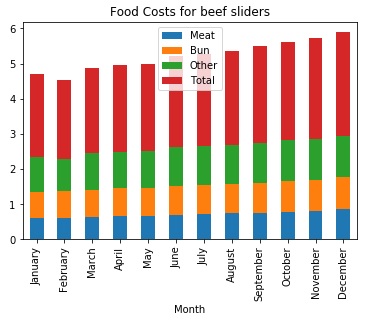
The graphs below were generated from the data in the Food Costs Spreadsheet.